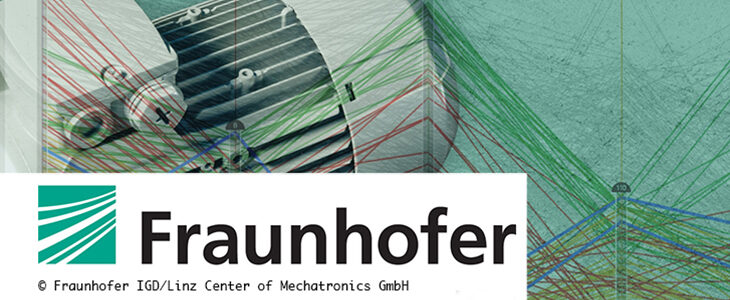
Design study by Fraunhofer & LCM
Decisions in product development aren't made easy. Especially when criteria are in conflict. Visualizing the alternatives helps to order the thoughts. A tool by Fraunhofer IGD makes it easier for engineers to select the optimal design for a commissioned product and creates transparent and easily understandable price/performance comparisons that lead to shorter coordination paths.
An engineer develops an electric motor that meets the specification ordered by the customer. Her assumption that a different material or a change in geometry can have an additional positive influence on the motor performance is confirmed by the simulations. But she's wondering how to report this to the customer, who is critical of the higher costs involved.
A clear visualization of alternatives helps decision making and saves time & money
The solution: A clear visualization of the alternatives, in which the preferred design candidates can be quickly narrowed down using combinable filters. When, for example, costs are increased (using a slider) within the price range the customer is willing to pay, the visualization seamlessly displays the effects on the remaining motor characteristics. In this way, the advantages and disadvantages of certain designs can be identified at a glance - without requiring in-depth technical knowledge. The customer and engineer decide based on the area of application: if, for example, the efficiency is less critical, a less expensive motor variant may be chosen.
With the interactive controls of this visualization application, decisions can be easily made visually and the coordination process for multi-criteria cost-benefit considerations can be significantly shortened.
Interactive visualization that puts the decision maker in the focus
In order for a visualization to effectively support a human analysis process such as decision making, the real-world operating conditions must be taken into account. For this purpose, the concrete problem definition, workflows and needs of the domain experts are analyzed to derive requirements for a visualization. Only then can a suitable visualization approach be selected and tailored to the domain. The described visualization was developed in close cooperation with engineers of the Linz Center of Mechatronics over a period of 1 ½ years within the context of CloudiFacturing. Thanks to this cooperation, a custom-fit problem solution could be developed that fits seamlessly into existing work and analysis processes. In their design study "PAVED: Pareto Front Visualization for Engineering Design", the researchers reflect on the successful implementation of this user-centered process.
Watch Lena Cibulski's presentation of the PAVED: Pareto Front Visualization for Engineering Design Study at EuroVis2020:
PAVED Study can be downloaded at Computer Graphics Forum:
Read more about the dedicated CloudiFacturing experiment:
Experiment 1 – Optimizing design and production of electric drives
 The project CloudiFacturing receives funding from the European Union’s Horizon2020 research and innovation programme (Grant No. 768892).